✦ SCREENSHOTS
Dashboard Preview
Click any image to see full-size view.
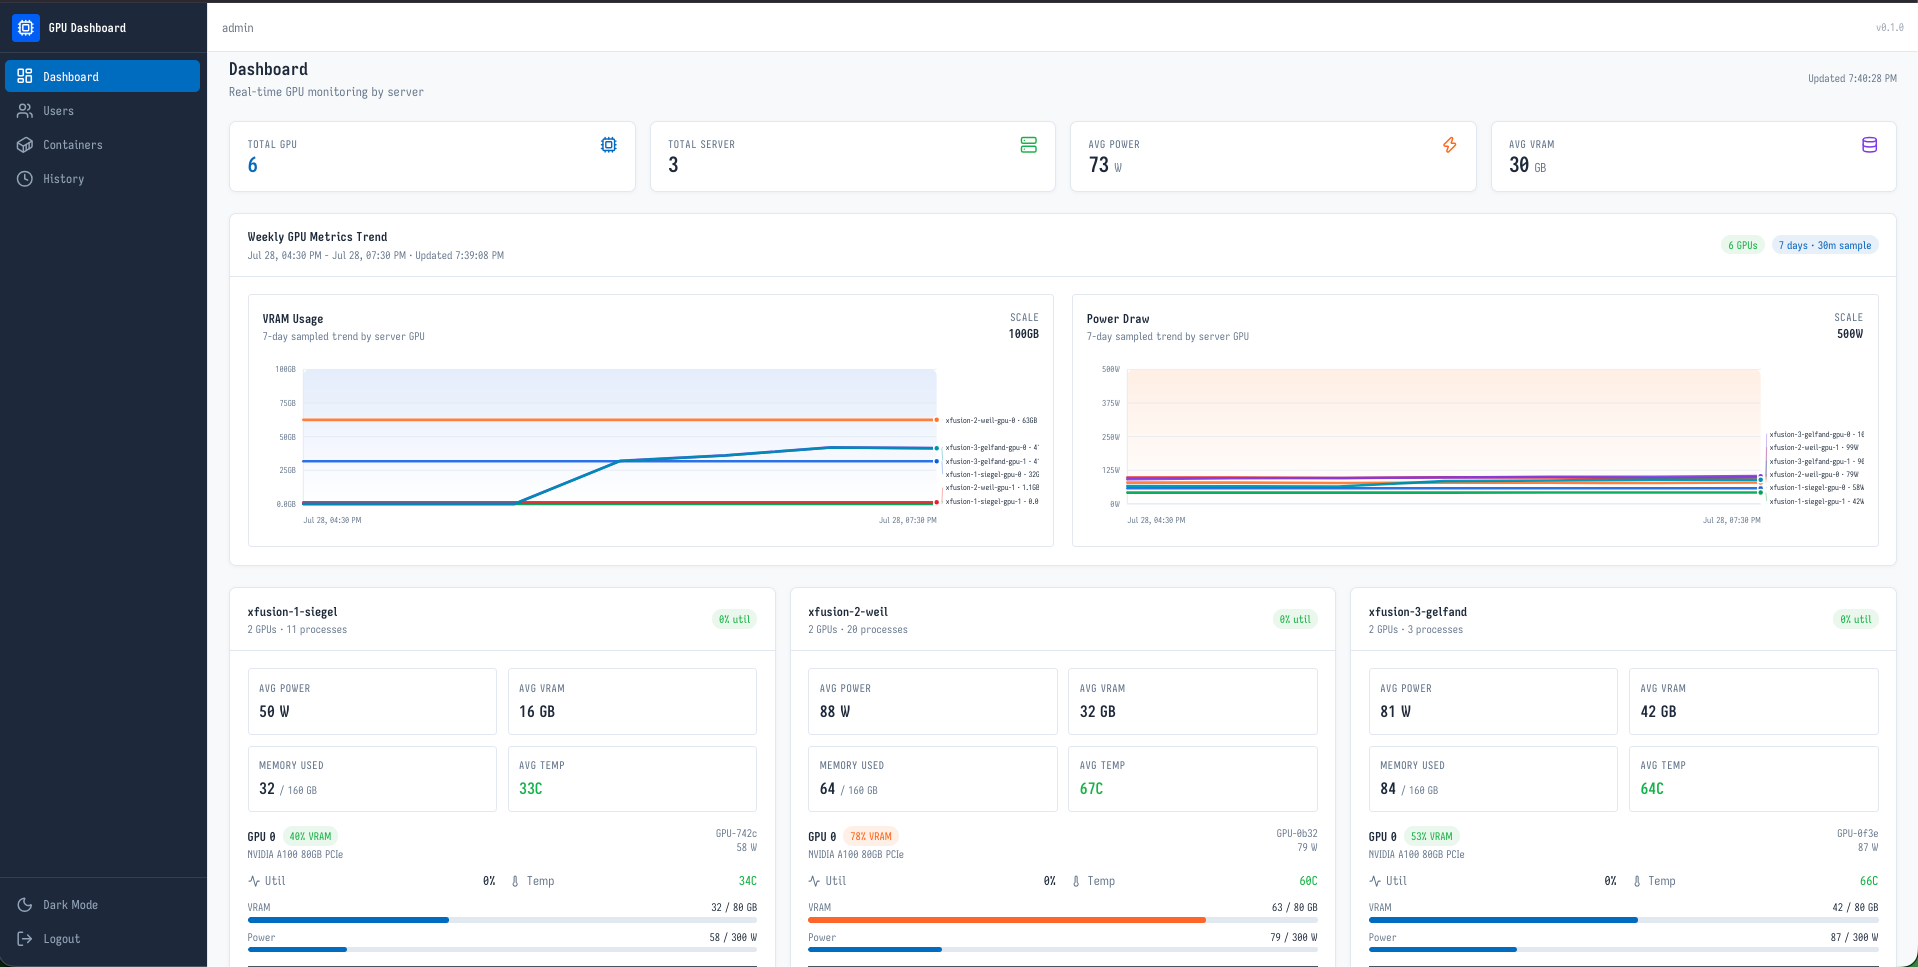
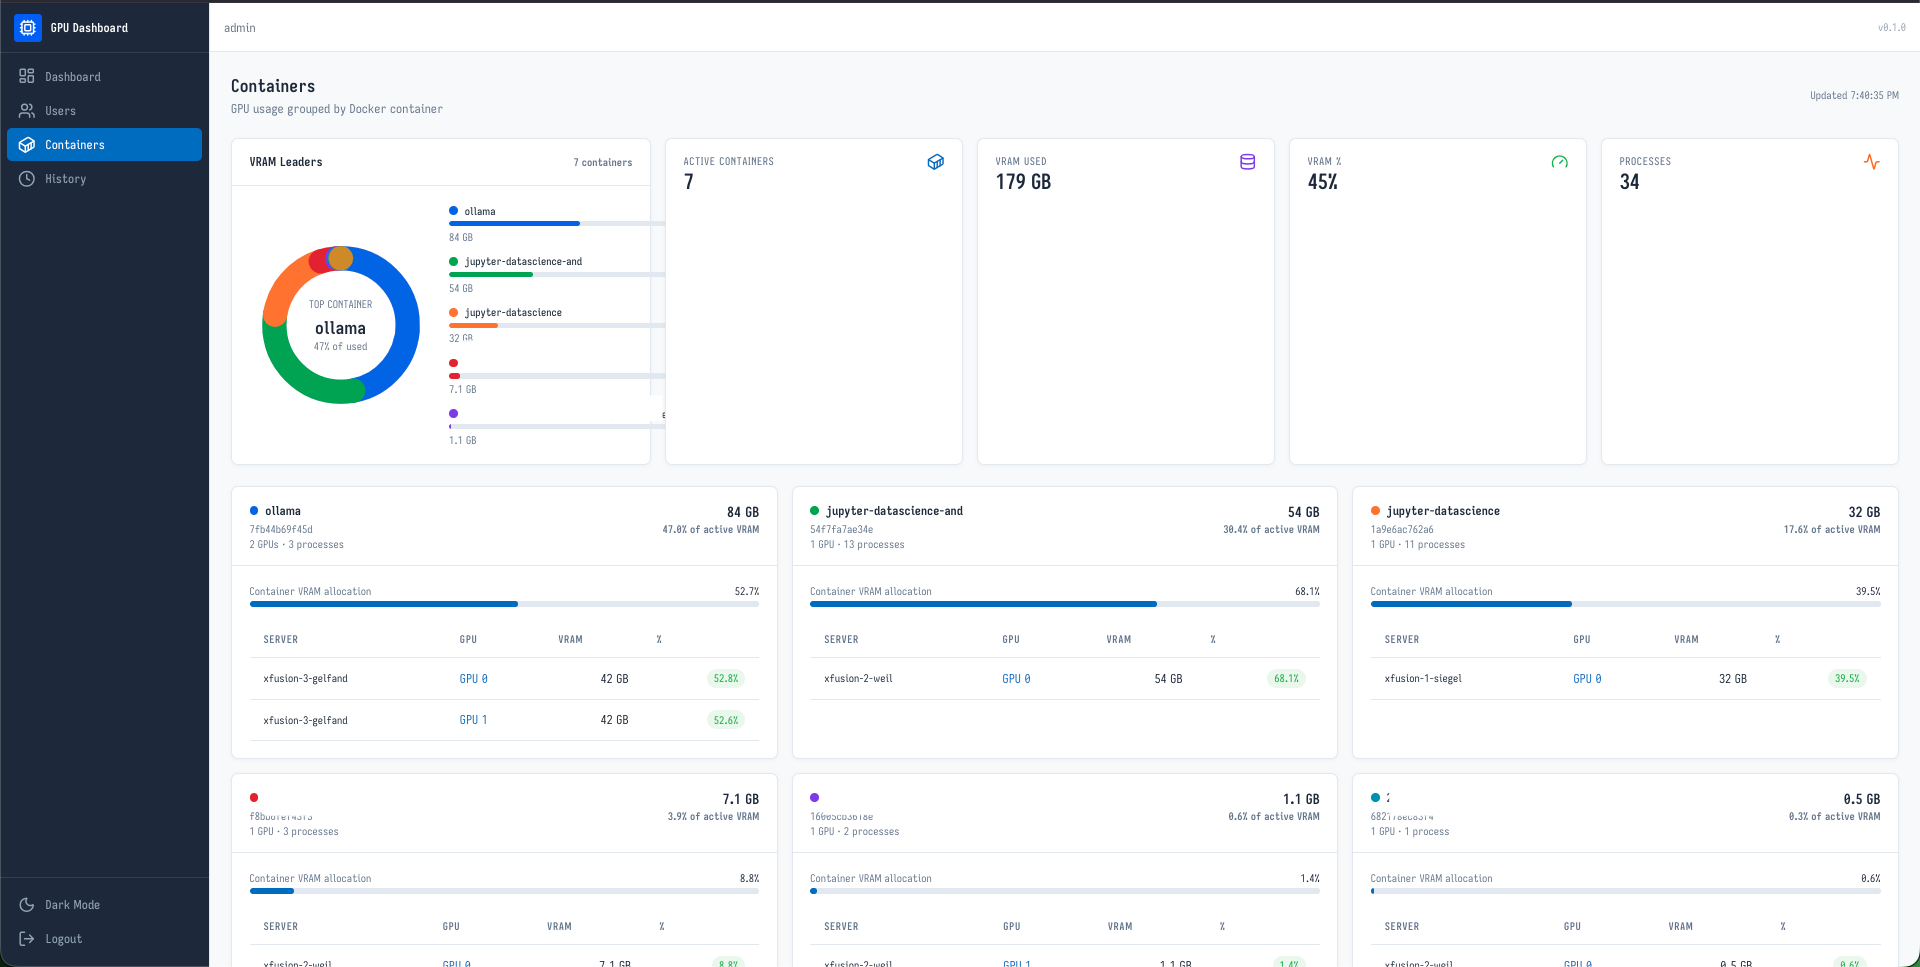
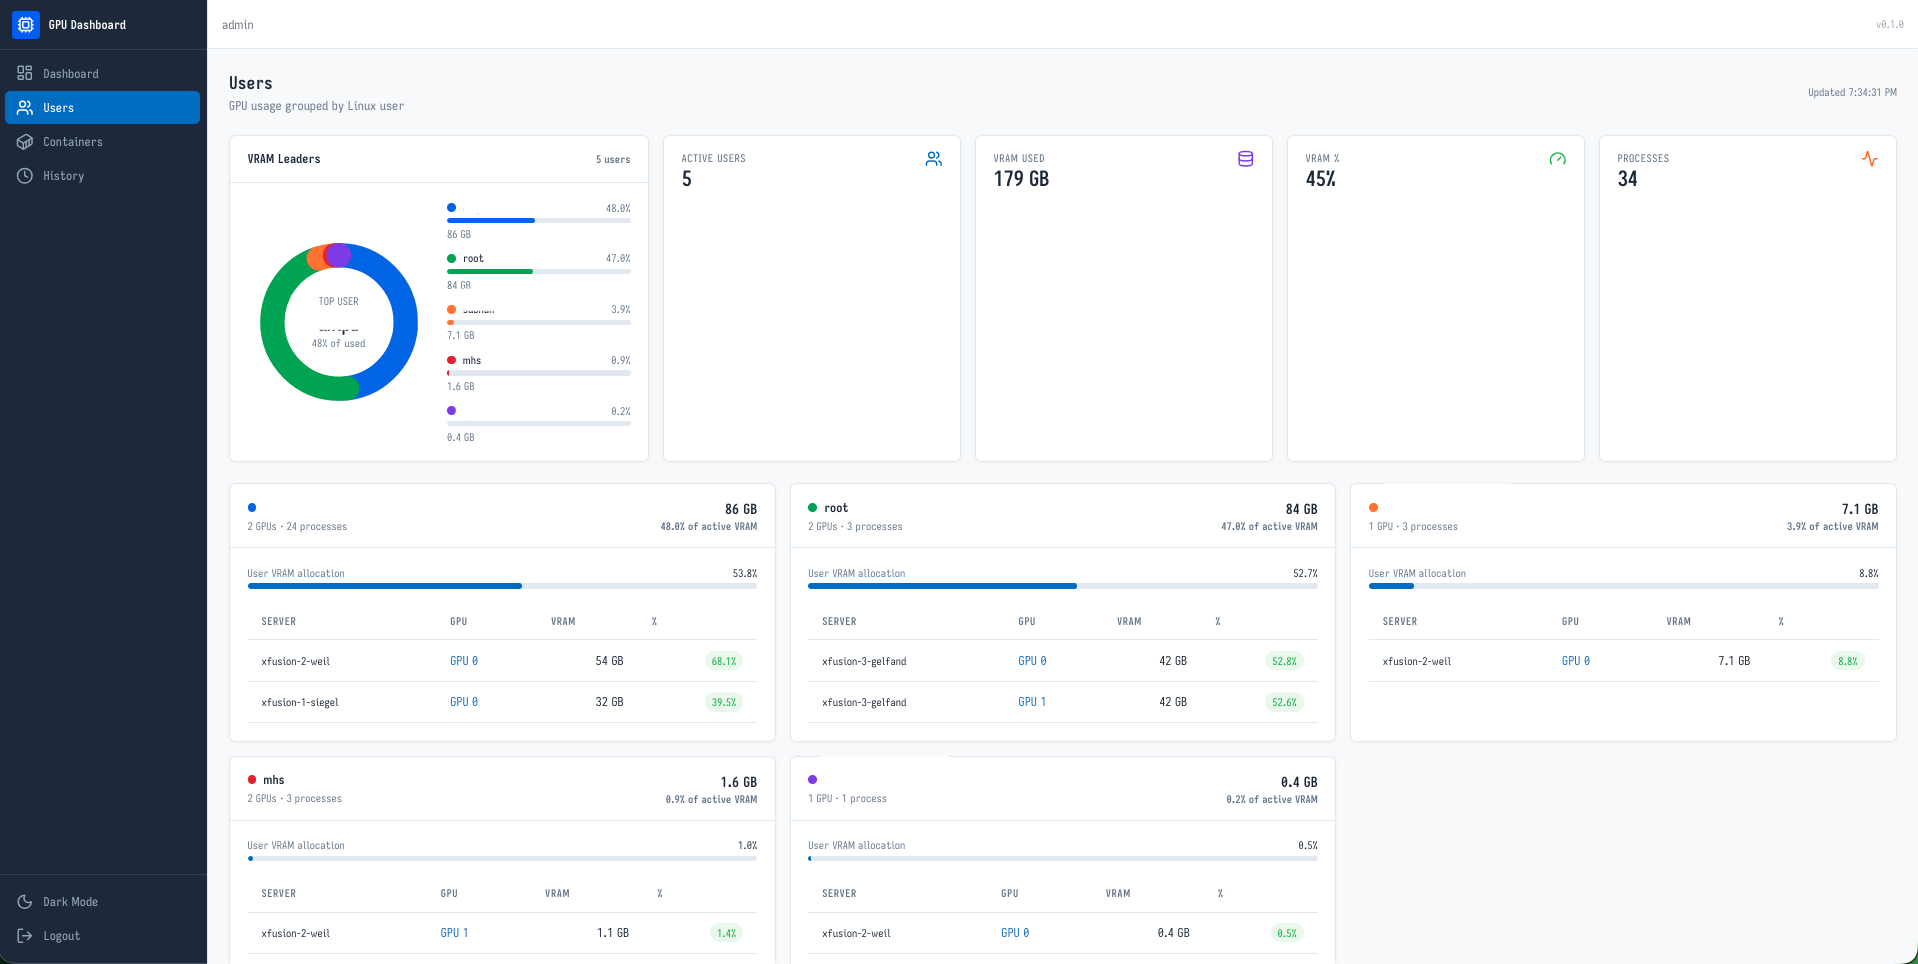
Lightweight agent collects NVIDIA & AMD GPU metrics every 5 seconds. The dashboard visualizes utilization, memory, temperature, power, processes, users & Docker containers.
Everything you need to monitor GPU fleets without paying for commercial tools.
All GPU cards across all servers in one view. KPI totals, utilization, memory, temperature, power draw, and fan speed.
Click any GPU card to see live stats, history charts, and running processes. Drill down by server and GPU index.
See GPU memory grouped by Linux user. Know exactly who is using which GPU and how much VRAM they consume.
Automatically detects Docker containers using GPUs. Shows container name and ID per process.
Query historical data with custom time ranges and sample intervals. Built on QuestDB for fast analytics.
Admin login, non-admin user management, custom brand name and logo. Light/dark mode built in.
Data pipeline from GPU servers to your browser — three lightweight components.
nvidia-smi / rocm-smi.Click any image to see full-size view.
Get from zero to monitoring in 5 minutes.
Dashboard server — any machine with Docker + Docker Compose (v2.24+), 1 GB RAM, 10 GB disk.
GPU servers — Linux with NVIDIA drivers (nvidia-smi) or AMD ROCm (rocm-smi), network access to QuestDB.
Run everything on one machine to see the UI. You won't see GPU data yet, but you can explore the dashboard.
git clone https://github.com/luthfiemka/gpu-server-monitoring.git
cd gpu-server-monitoring
docker compose up -d
# Open http://localhost:5173 — login: admin / admin
QuestDB web console available at http://localhost:9000.
On your dashboard server (no GPU needed):
git clone https://github.com/luthfiemka/gpu-server-monitoring.git
cd gpu-server-monitoring
docker compose up -d
For custom credentials, create .env:
echo "ADMIN_USER=myadmin" >> .env
echo "ADMIN_PASS=mysecret" >> .env
echo "ORIGIN=http://your-server:5173" >> .env
docker compose up -dDownload binary from release/ folder, copy to each GPU server:
# On the GPU server:
sudo mv gpu-monitoring-agent-linux-amd64 /usr/local/bin/gpu-monitoring-agent
sudo chmod +x /usr/local/bin/gpu-monitoring-agent

# Create config:
sudo mkdir -p /etc/gpu-monitoring
sudo tee /etc/gpu-monitoring/gpu-monitoring-agent.conf <Open http://your-server:5173. You should see GPU cards with live metrics.
Check QuestDB directly:
SELECT count() FROM gpu_metrics;
SELECT * FROM gpu_processes LIMIT 5;
If empty, check agent logs: journalctl -u gpu-monitoring-agent -f
Go to /settings to set brand name, logo, and add non-admin users. Repeat Step 2 for every additional GPU server — all point to the same QuestDB.
| Route | Description |
|---|---|
/ | All GPU cards across all servers, KPI totals, process table |
/gpus/{server}/{id} | Per-GPU live stats + history chart + processes |
/users | GPU memory grouped by Linux user |
/containers | GPU usage grouped by Docker container |
/history | Time-range query with sample-by interval |
/settings | Brand name, logo, manage non-admin users |
Go 1.23+ SvelteKit 2 + Svelte 5 QuestDB 8.2.3 Docker Compose
Agent written in Go with zero external dependencies. Frontend uses Svelte 5 runes, Tailwind CSS 4, and server-side QuestDB proxy. Database auto-creates tables — no migrations needed.
| Variable | Default | Description |
|---|---|---|
QUESTDB_URL | http://localhost:9000 | QuestDB REST API endpoint |
ADMIN_USER | admin | Dashboard admin login |
ADMIN_PASS | admin | Dashboard admin password |
ORIGIN | http://localhost:5173 | Public URL of dashboard |
interval | 5 | Agent collection interval (seconds) |
systemctl status gpu-monitoring-agent. Check QuestDB: SELECT count() FROM gpu_metrics.nvidia-smi to verify drivers. Check config file path.nc -zv questdb-ip 9009.admin / admin. Custom via ADMIN_USER/ADMIN_PASS env vars.